Wavelet resolver
Info
This feature resolver is currently in beta phase (03.2026). (Added after mzmine 4.10)
Note
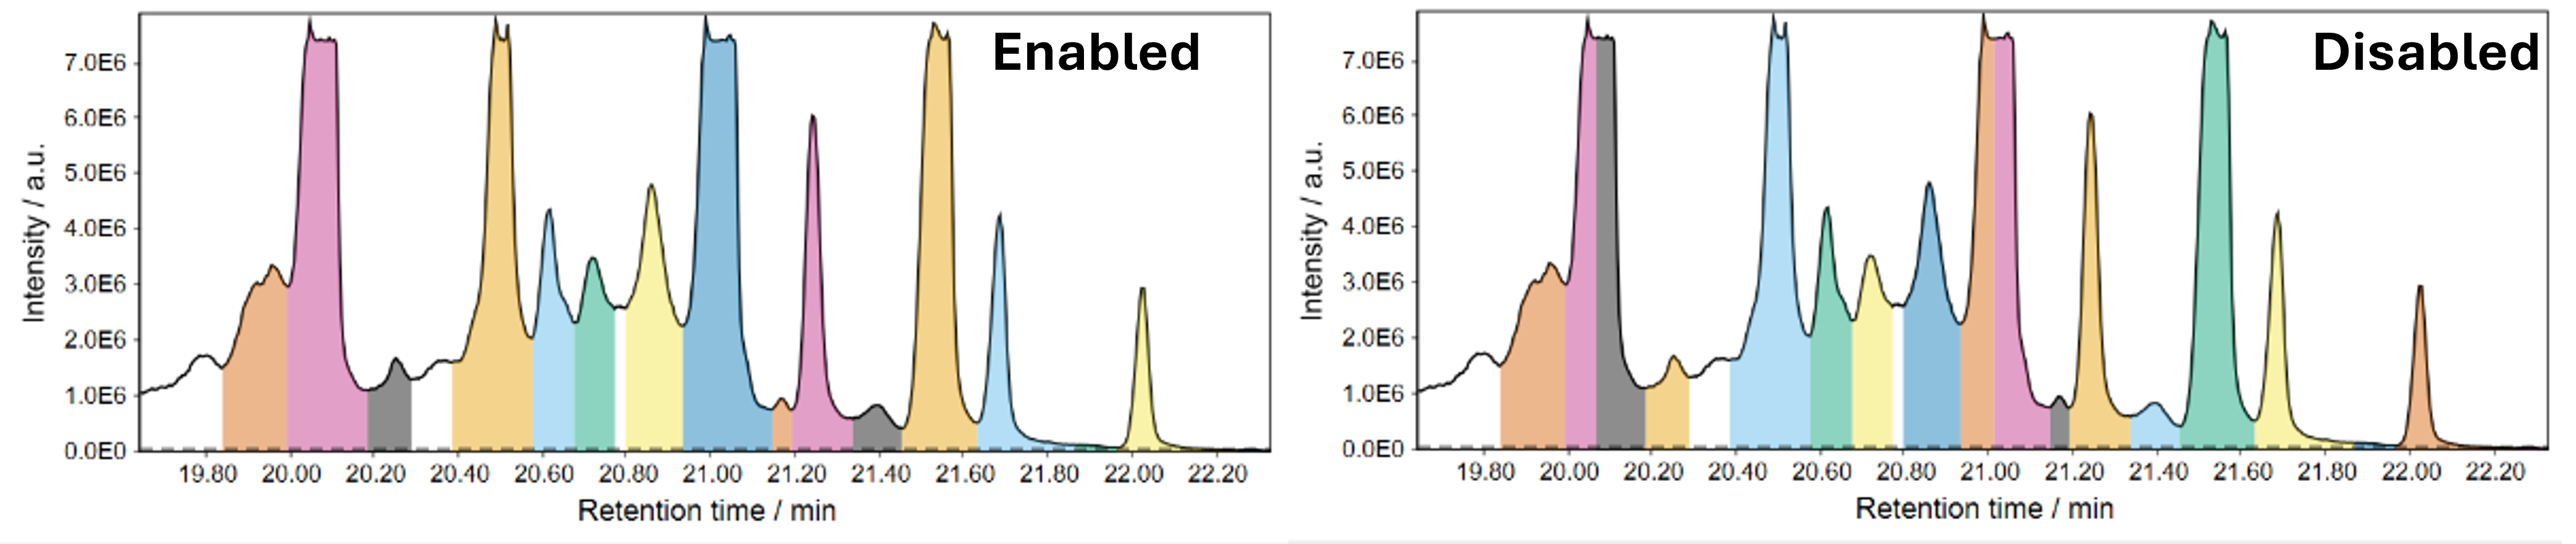
Wavelet resolver vs. Local minimum resolver:
While the local minimum resolver is the quicker resolver, it may struggle with chromatograms with high baseline and peaks on top said baseline. The wavelet resolver takes longer to compute, but may outperform the local minimum.
Parameters
Signal-to-noise threshold
Minimum required signal-to-noise ratio of a peak. The noise is calculated by the standard deviation (\(STD\)) or median absolute deviation (\(MAD\)) (see noise calculation and noise window factor). The signal height (\(S\)) is determined by the peak height minus the average of the two edges.
Top to edge (SNR override)
If a potential feature does not match the SNR threshold, check if the top/edge ratio is above this threshold.
Minimum height
Minimum absolute required of a signal to be retained as a feature.
Noise calculation
Choose a method to calculate the noise around a potential signal. Other closely eluting signals are not used for noise/background calculation.
Default: Standard Deviation
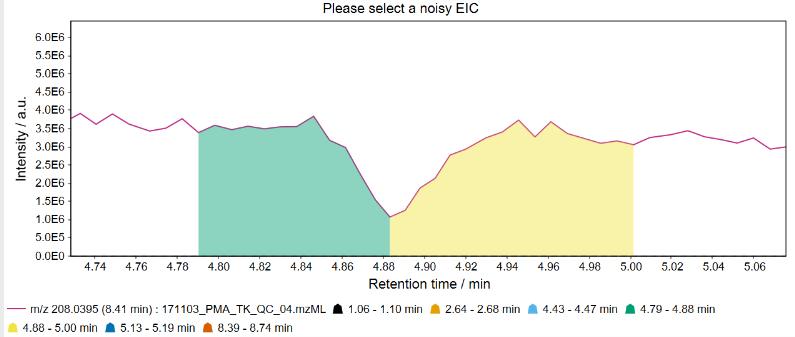
Dip filter
Filters V-shaped dips in the baseline that are caused by instable sprays and may behave like an unresolved double peak.
Default: enable for LC-MS, disable for GC-EI-MS
Example: Dip detected as feature without the dip filter enabled.
Advanced parameters
Scales
Scales (widths) of the wavelets. Multiple wavelets allow detection of signals of varying widths. More scales increase the processing time. Larger scales allow recognition of wider peaks, small scales allow recognition of narrower peaks. This scales with the number of points per peak, but should not be seen as a 1:1 factor. (A scale of 1 will not cause recognition of peaks with only 1 signal).
If disabled/default: 0.5, 1.0, 1.5, 2.0, 3.0, 5.0, 8.0, 10.0
Noise window factor
The window around a potential signal to calculate the signal-to-noise ratio in. The window is defined by this factor multiplied by the peak width. Only signals that do not belong to a potential other peak are used for noise calculation. At least 6 signals must be found to calculate the noise by the selected noise calculation method. Otherwise the top-to-edge ratio of the signal must match the selected SNR.
If disabled/default: 3 is used
Required fitting scales
Minimum number of fitting wavelet scales for a peak to be retained.
If disabled/default: 2 Note: Enable and set to 1 to disable this filter
Apply robustness iteration
Regions of potential peaks are not used for noise calculation. This may cause too many regions being excluded. Applying a second iteration allows more robust noise calculation for signals in crowded regions of the chromatogram.
Default: true
Edge detection
Define an algorithm to detect the edges of a peak. Local minimum: Continues the search for a minimum as long as the next point (within a tolerance depending on peak width) is lower than the previous. Absolute minimum: Continues the search as long as the next point (within a tolerance depending on peak width) is lower than the previous absolute minimum. Slope: Continues the search until an increasing slope is reached. Uses varying window width depending on peak width.
If disabled/default: Absolute minimum is used
Allow sign changes every N points
Removes noisy signals with lots of up/down movement.
Filters by the number of sign changes (\(S\)) in the slope between two points in a potential feature. If the slope changes from positive to negative or vice versa, it is counted as a sign change. Since a peak is expected to have a high point, one sign change is expected per potential peak and subtracted from the number of counted sign changes. The number of additional sign changes (\(S-1\)) is then divided by the total number of data points in a peak \(\frac{(S-1)}{N_{points}}\). This number is then multiplied by the value of this parameter \(p\). We call the result of this formula the relative jaggedness \(J_R\). If the relative jaggedness is \(\le 1\), the potential peak is discarded.
\(J_R = \frac{(S-1)}{N_{points}} \cdot p\)
If disabled: 2 is used. To not use this filter enable and set to 1.
The effect of the filter is visualized here:
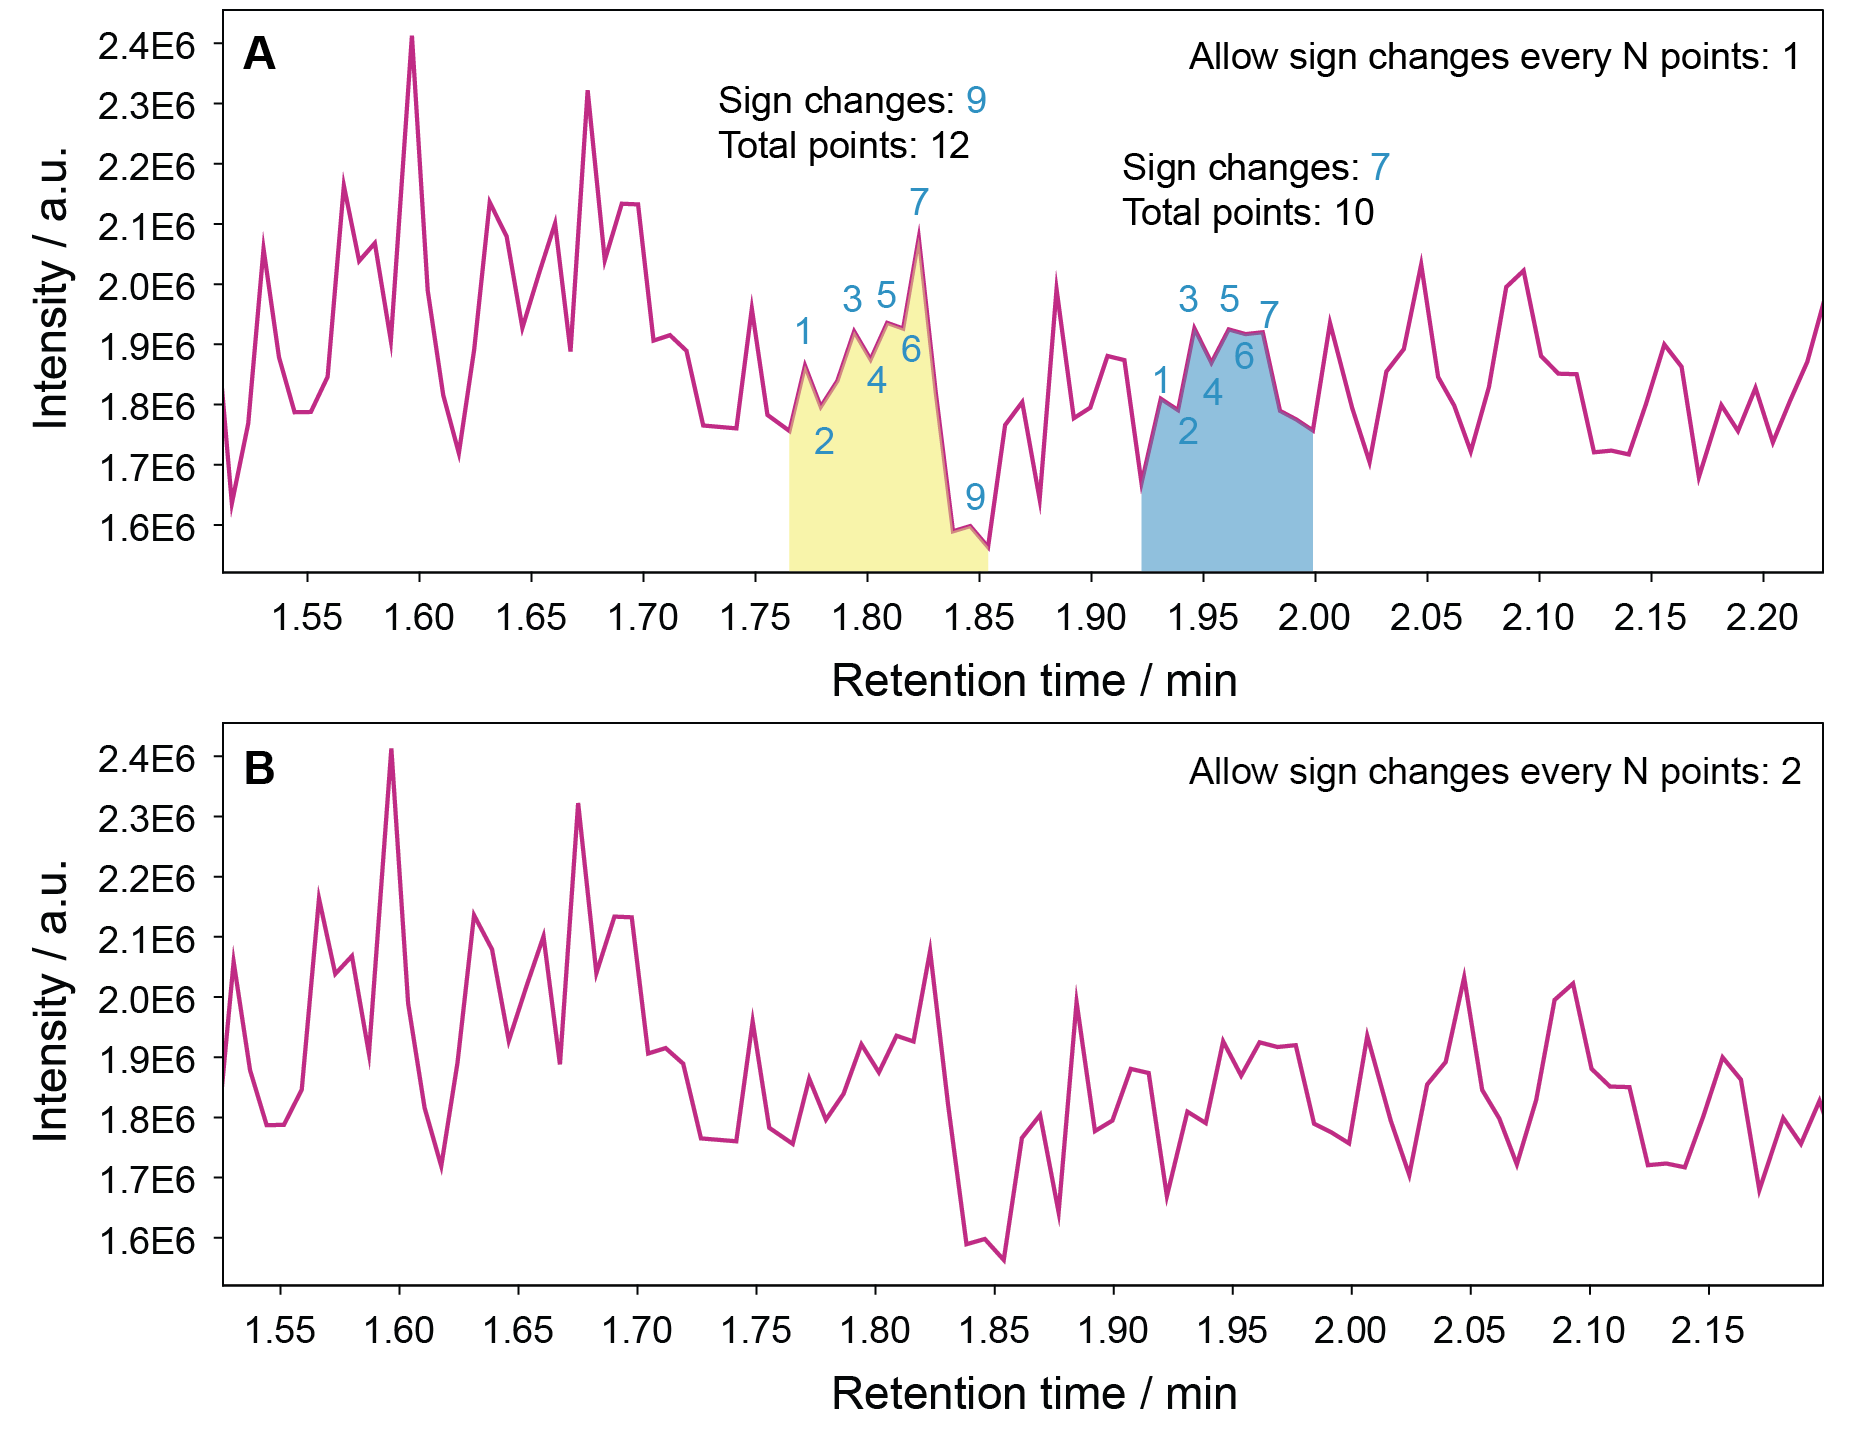
The yellow signal in panel A shows 9 sign changes for 12 data points, the blue signal shows 7 sign changes for 10 data points. The jaggedness is thereby calculated as:
\(J_{R,yellow} = \frac{(9-1)}{12} \cdot p = \frac{8}{12} \cdot p = \frac{2}{3}p\) \(J_{R,blue} = \frac{(7-1)}{10} \cdot p = \frac{7}{10} \cdot p = 0.7p\)
For a parameter value \(p\) of 1, both signals are retained, as \(J_R \le 1\). If a sign changes is only allowed every \(p = 2\) points, it results in \(J_R > 1\) in both cases.
(Note: S/N had to be set to 2 to allow these signals to be picked up at all.)
Maximum ratio of similar height signals in background
Noisy baselines may pass the SNR filter due to low standard deviation if the baseline is relatively stable. This filter checks if there are a lot of signals with a similar absolute height (80%) as a potential peak. If that is the case, the peak is removed.
If disabled: (0.10) will be used as default. Note: A value of 1 disables this filter. Note: It may make sense to disable this filter (set to 1) to detect signals that are placed on an increasing baseline.
Saturation filter
Detects if a peak has a flat top signal due to saturation of the MS detector.
Default: true