Mass detection algorithms
Mass detection can be done with the following six algorithms:
- Factor of lowest signal
- Centroid
- Exact mass
- Local maxima
- Recursive threshold
- Wavelet transform
- Auto
Factor of lowest signal
This mass detector is suitable for centroid or profile data.
Choose the Factor of lowest signal for both centroided or profile data where each spectrum contains noise signals, often represented by many signals at the same low intensity (spectral grass). This may correspond to static noise or single counts. This algorithm removes all data points below a spectrum's lowest intensity multiplied by a factor. If the spectra are free of noise, for example because they were already filtered, use an absolute intensity threshold.
Centroid
This mass detector is suitable for already centroided data.
Centroid algorithm assumes that each signal above a given noise level is a detected ion. Here, the noise level is set as an absolute fixed value for each MSn level.
Exact mass
The exact mass algorithm is highly recommended for profile MS data.
This mass detector first searches for all local maxima within the spectrum, which then form candidate ions.
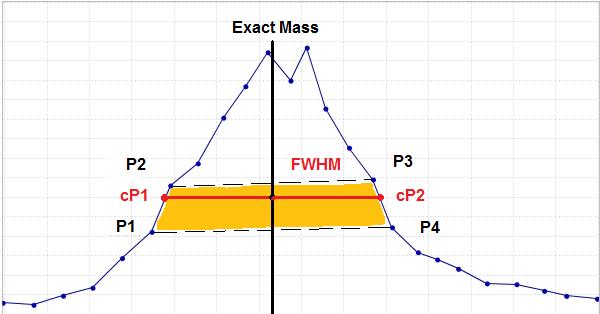
This method calculates the exact mass of a peak using the FWHM (full width at half maximum) concept and linear equation (\(y = mx + b\)). FWHM is the difference between the two values of the independent variable at which the dependent variable equals half of its maximum value.
First, the method locates the data points located nearest to the peak center at half of the maximum intensity (P1, P2, P3, P4). With these four points it calculates two points (cP1, cP2) that define the width of the peak. The exact mass is then obtained as the center of the width.
This method is suitable for high-resolution MS data, such as provided by FTMS instruments.
If the continous data is too noisy, one can use recursive threshold algorithm.
Local maxima
This mass detector is suitable for profile (continuous) MS data.
The local maximum mass detector segments the spectrum into continuous m/z regions, resolves overlapping peaks using a valley/rise criterion, and returns a centroided m/z and intensity for each resolved peak. It is an alternative to the Exact mass detector for profile data and is well suited to low-resolution or moderately noisy spectra.
Parameters
Noise level
Absolute intensity threshold. Data points below this value are not considered. The effective
detection threshold is max(noiseLevel, 2 × lowestNonZeroIntensity) — this automatically
rejects peaks sitting at the spectral noise floor even when the noise level is set to zero.
Minimum non-zero points
A candidate peak must contain at least this many data points with intensity > 0. Increasing this value avoids detecting very narrow spikes or single-point artefacts. Default: 3.
Intensity calculation
How the reported intensity for each detected peak is calculated:
- Height (default) — the maximum intensity within the peak region (valley to valley).
- Area — the sum of all intensities within the peak region (valley to valley).
Algorithm
-
Region segmentation — The spectrum is split into continuous m/z regions by detecting gaps larger than the maximum observed m/z spacing between adjacent non-zero data points. Regions with fewer than Minimum non-zero points data points or no point above the noise level are discarded.
-
Local maxima detection — Within each region, all local maxima are identified as peak candidates.
-
Valley/rise peak resolution — Consecutive candidates are compared pairwise. Two candidates are treated as separate peaks if the valley between them drops below 70 % of the active peak's intensity AND the next candidate rises above ~143 % of the valley intensity. Otherwise the candidates are merged and the taller one is kept as the active peak.
-
Centroid m/z — The m/z of each resolved peak is computed as a linearly intensity-weighted average of all data points above 40 % of the peak maximum, restricted to a symmetric window around the apex.
-
Output intensity — Reported as peak height or valley-to-valley area depending on the Intensity calculation setting.
Recursive threshold
The algorithm finds all m/z ranges within the given limit in a recursive way.
Initially, it looks at the whole range of data points. If the m/z width of this range is not within given limits, a minimum data point is found and used to split the range in two parts. The same algorithm is then applied recursively on each part. Recursion continues until all m/z ranges fitting into the given width limits are found.
Final m/z values are determined as local maxima of the identified m/z ranges.
This mass detector is suitable for continuous data, which has too much noise for the Exact mass detector to be used, but which shows a consistent width of m/z peaks.
Additional parameters
Min m/z peak width: Minimum acceptable peak width in m/z.
Max m/z peak width: Maximum acceptable peak width in m/z.
Recursive threshold method can be used with the noisy continuous data that shows a consistent width of m/z peaks.
Wavelet transform
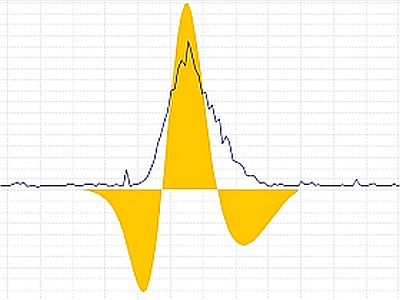
The method uses the Mexican Hat wavelet model of the continuous wavelet transform (CWT) algorithm.
The search of mass spectrum peaks is executed in three steps. First, the data point intesity is converted into wavelet domain. Second, all the local maxima of the calculated wavelet are found. Finally, m/z peaks (ions) are declared in those points, where the wavelet has a local maximum. The m/z peak is formed with the selected data point (mass and intensity) using the wavelet and all surrounding data points. The final m/z value of the ion is calculated as an average of m/z values of surrounding data points weighted by their intensity.
Mathematical model
In numerical analysis, the Mexican hat wavelet is the normalized second derivative of a Gaussian function.
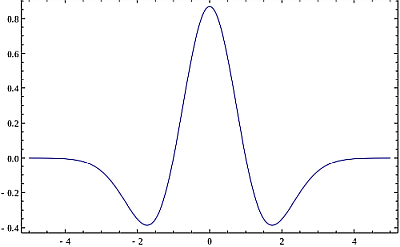
The parameter \(t\) is the intensity of each data point in the curve, and \(\sigma\) corresponds to the standard deviation.
To simplify the process of wavelet calculation, the original function is transformed into two parts, where \(W_{c}\) is the wavelet coefficient and \(y\) is the intensity of the wavelet at certain point. In the following formula, \(t\) corresponds to the Wavelet window size (%) parameter.
The lower (LL) and upper (UL) limits, where the Mexican Hat wavelet is evaluated, are from -5 until 5. The incremental step used in this range is the result of limits range division by 60,000.
Additional parameters
Scale level
Number of wavelet coefficients to use in m/z feature detection. Serves as the scale factor that either dilates or compresses the wavelet signal.
When the scale factor is relatively low, the signal is more contracted, which results in a more detailed resulting graph and more noisy peaks are detected. On the other hand, when the scale factor is high, the signal is stretched out, which means that the resulting graph will be less detailed with a smoothed signal.
Wavelet window size (%) The size of the window used to calculated the wavelet signal. When the size of the window is small, more noisy peaks can be detected. The proper value of this parameter may help to avoid the undesired noise peaks.
The Wavelet transform mass detector is particularly suitable for low-resolution and noisy data.
Auto
Auto mass detector recognizes if the spectrum is of profile or centroided data type and applies centroid or exact mass algorithms correspondingly.