Feature table
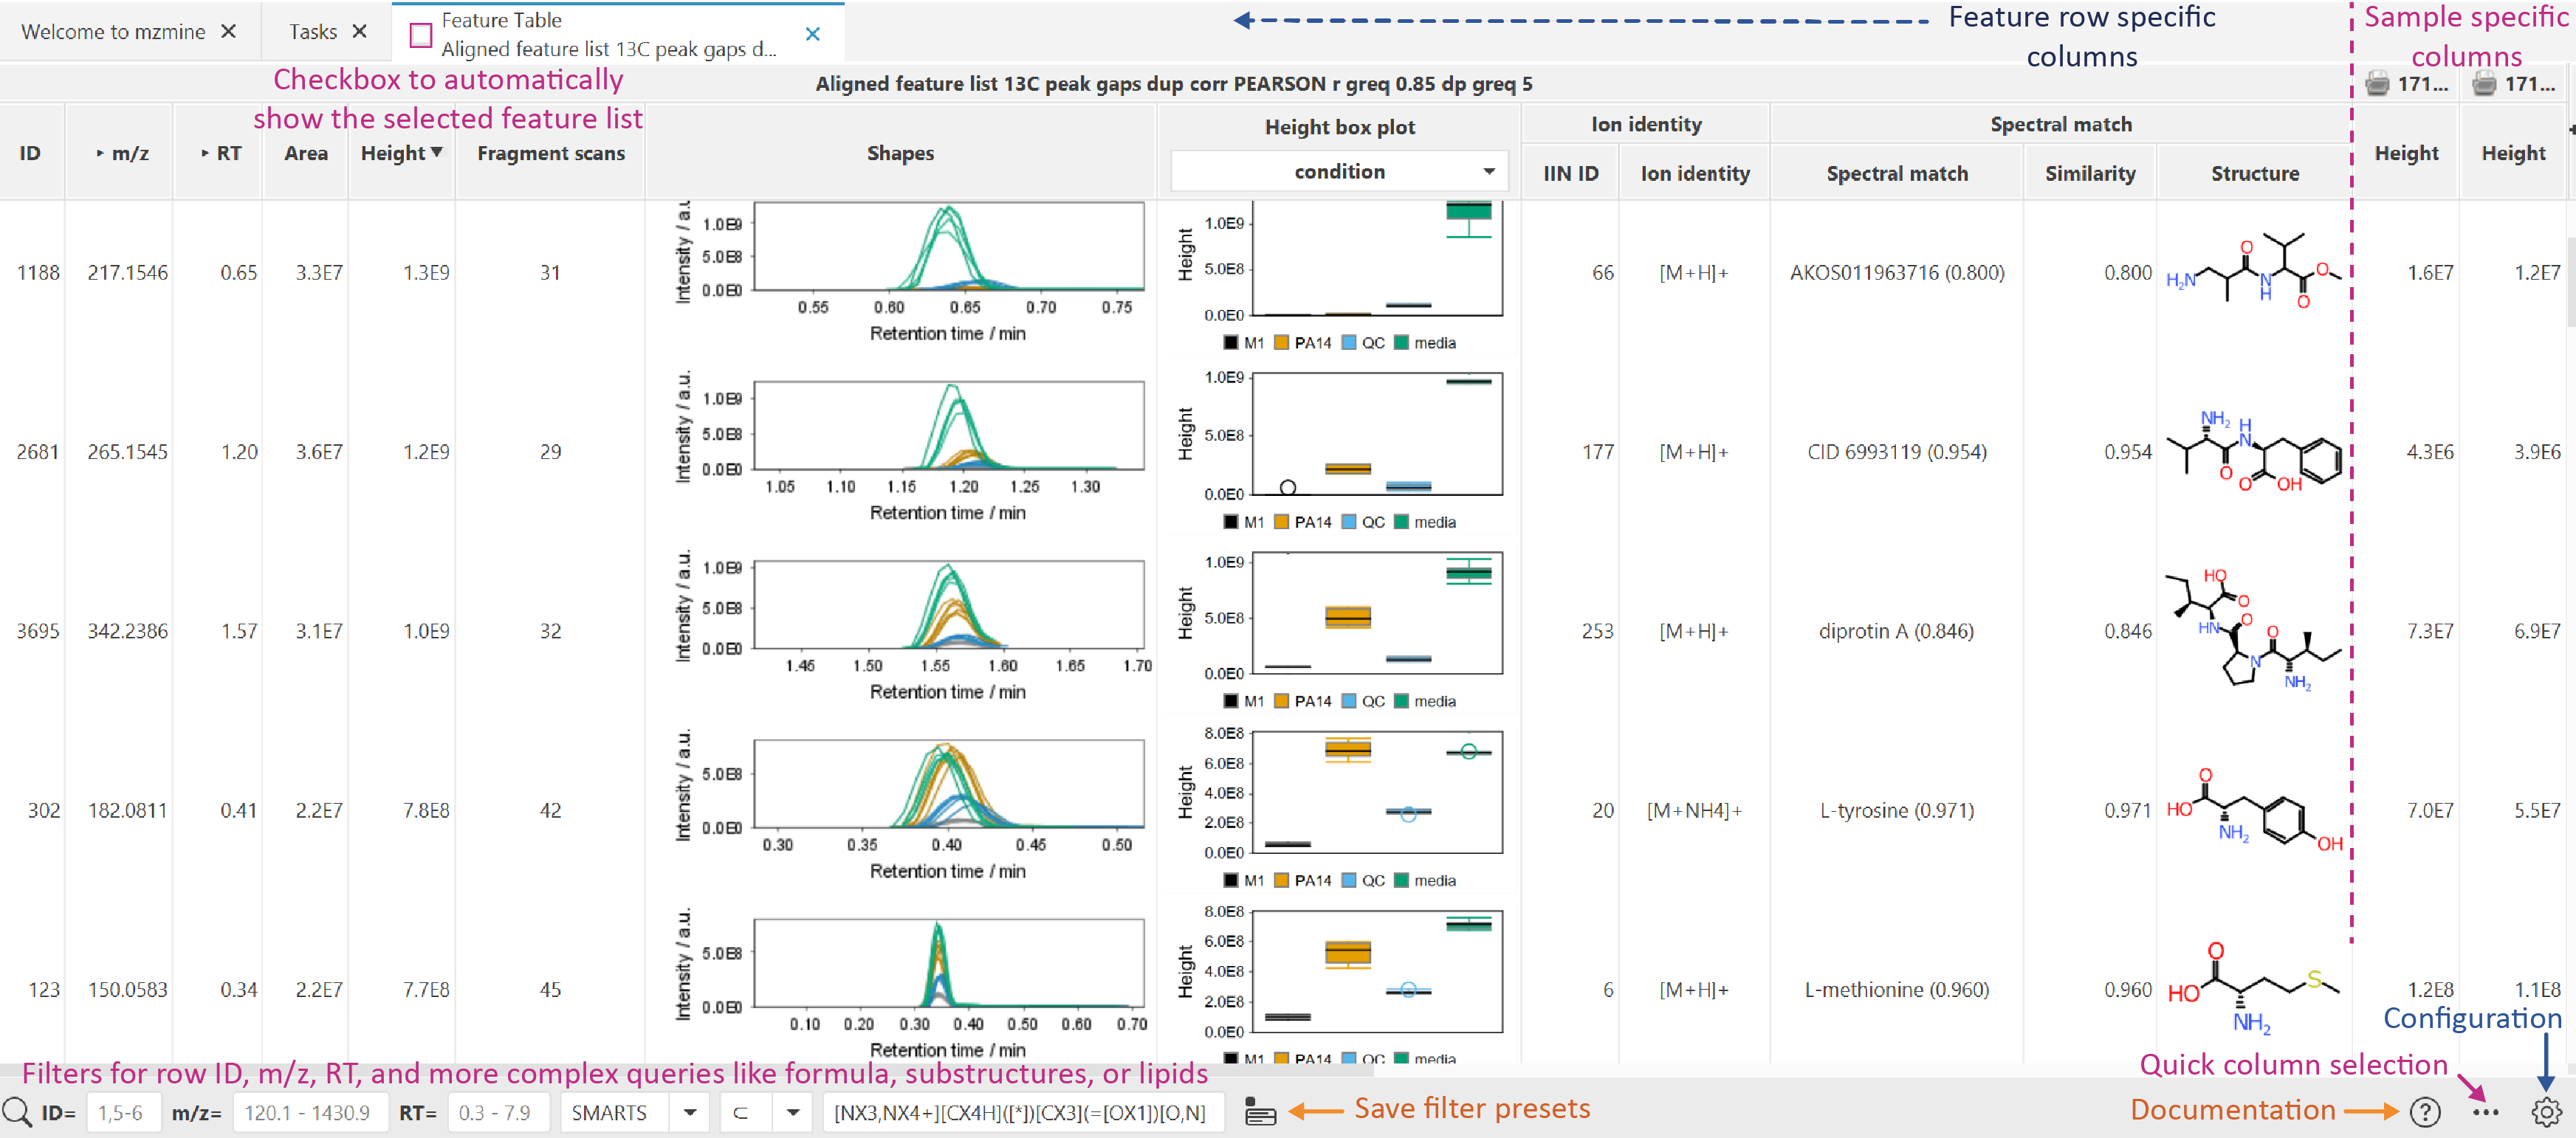
Columns in the table can be displayed or hidden on demand, using the quick column menu on the "+" ** button on the top right or the ... button in the lower right menu. More configuration options are available from the * *parameter menu button in the right lower corner.
Tip
The shapes column shows the retention time feature shapes. This column and other graphic columns may be hidden when opening larger tables with many samples. Activate any column from the quick column menu or the configuration.
The Feature tables include several groups of columns:
- Feature summary columns: All columns from left until the sample-specific columns. They define summary statistics for each feature list row like the unique ID, average m/z, maximum height, total number of fragment scans, spectral library matches, lipid matches, etc.
- Sample-specific columns: Have a sample icon and name on top and they might be hidden by default for large datasets. They can be accessed through the quick column selection (all columns with the Feature: prefix) or via configuration.
- Box plots are available based on height and area and add a dropdown selection to choose the metadata column for sample grouping. Double-click to reach the statistics dashboard.
Tip
Double-click on different cells like an annotation structure, the box plots, or the shapes to open other visualizers and tools.
State column describes the feature status in a chosen file using several color-coded options:
- Blue - a feature was found in a primary feature detection,
- Gray - a feature was found in a secondary feature detection (e.g., using Gap filling, after alignment),
- Black - a feature was defined manually.
Configuration options
Quick column selection offers quick toggle buttons to show / hide groups of columns. Also the Compact table button helps to get a standard smaller table.
The configuration dialog provides parameters to control the Feature summary columns and the Sample-specific columns. Also, there are options for the default feature intensity and chart-specific options.
Right-click menu
Open a context menu by right-clicking on any cell in the table. The column cell may change the available options depending if the column is a Feature summary column or Sample-specific column. There are various visualizers and other tools available from this menu.
Check out the Show/Feature overview IIMN networks for a composition of annotations, networks, and more.
Feature list filters
In the bottom panel, there are multiple filters to focus on specific properties of your feature list rows like annotations or retention time and m/z.
- ID: Filters rows by their ID column either by single ID, ranges (e.g., 1-10), lists (e.g., 1,2,3), or a mix 1,5-9.
- m/z: Filter the row m/z column. A single value is interpreted as a range with this significance like 200.1 will range from 200.1 - 200.2 and 200.15 will range 200.15-200.16. Or enter ranges directly like 200 - 500.
- RT: Filter the row retention time (RT) column. A single value is interpreted as a range with this significance like 1 will range from 1 - 2 and 2.5 will range 2.5-2.6. Or enter ranges directly like 1 - 10.
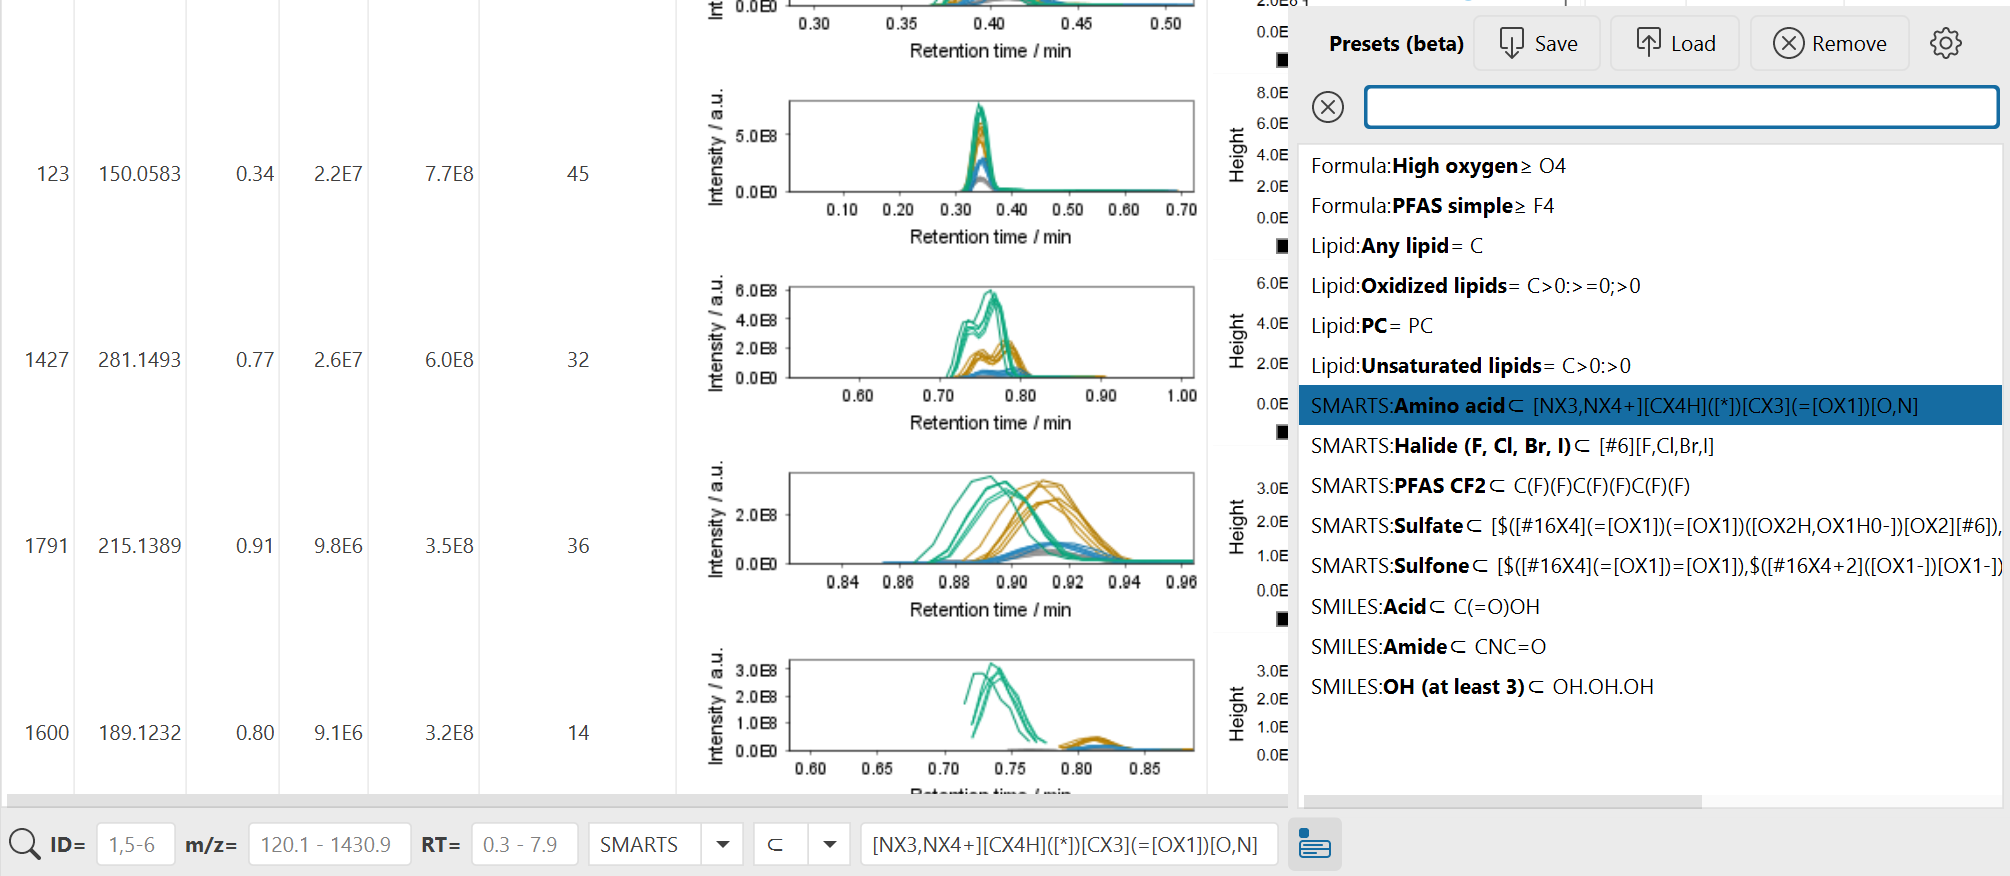
Flexible feature list filter
This filter is defined by a search type, matching mode, and textual query. In general, annotation search types will match against any annotation like spectral library match, lipid match, or other feature annotations from other modules. All annotations are considered, this means that sometimes a row will match the filter but the reason is not the primary annotation visible but a secondary one that may be hidden in the list of, e.g., library matches.
This filter is also available in the Feature list rows filter module to apply the filter to a feature list and retain its results.
Matching modes
Matching modes define either direct equality or unequality or define minima / maxima. A special case is ⊂ ("contains") which is used for substructure matching and substring matches. This is usually used for substring name matching where the whole substring needs to be contained, but there are also other substring matching modes in all and any that match each word in a query separated by space, semicolon (;), or comma (,) symbols.
Substring ("contains") matching types:
- ⊂: The target contains the whole query string
- all: The target contains all words of the query, separated by space, semicolon, or comma symbols
- any: The target contains any word of the query, separated by space, semicolon, or comma symbols
Search types
- Comment (row): Searches in the Comment column for each row. This column represents comments on the feature list row level. Useful for tag-based filtering in combination with substring search * any or all* (see below).
- Comment (row): Searches in the Comment column and additional JSON for each compound annotation. The comment and json columns can contain additional information like user-specific fields. This filter combines well with substring search any or all.
- Ion identity ID: Find all rows of the same ion identity ID
- Ion type: The adduct, in source fragment, or other ion type detected.
- Compound name: Any annotation's compound name matches, best to use a substring match
- IUPAC name: Any annotation's compound name matches, best to use a substring match
- Formula: Molecular formula, options to define a minimum formula
- Formula range: Molecular formula range by defining a minimum and maximum formula and the number of atoms need to be within these bounds. e.g., C6Br - OBr3 matches every formula that has at least 6C 1Br and at max 1O 3Br.
- SMILES / InChI: Matches exact structures or substructures defined by SMILES or InChI. For example, SMILES CNC=O matches amides
- SMARTS: Matches substructures and is more flexible than SMILES or InChI. Theory Examples
- Lipid: Lipid filter is designed for mzmine's rule-based lipid matching module but also works for other annotations like library matches, if the compound name uses the standard lipid short nomenclature. See examples below.
- Fragment scans: Filter for a minimum number of fragment scans in the fragment scans column, which all fragment scans across all samples.
Tag-based filtering
In the feature table, the Comment column provides the option to add comments or tags to each row, describing the whole row instead of just a single compound annotation. This field can be used to tag rows and the flexible feature filter below and in the feature table or in the Feature list rows filter can search for multiple tags in search modes any or all.
In the any or all search modes, the query is split into words (tags) by all space, semicolon, and comma symbols.
Tip
Enter tags into the Comment column to describe each feature table row. Use the Comment (row) filter with mode any or all to match tags entered into the query field. Separate tags in the query by spaces, commas, or semicolons. Example: Enter comment media, impurity in a row column and then search for tags by entering query: impurity or impurity, media (order of tags does not matter in modes any/all).
Lipid filter
Enter the following query to match specific lipid matches:
- C for any lipid class
- PC only define class
- C20:2 for 20 C and 2 double bonds
- PC20:2 also specifying the lipid class as PC
- C>20:2 for more than 20 C and exactly 2 double bonds
- C>20:>2 also more than 2 double bonds
- PC18:2_18:0 defining chains
- PC>18:>2_>18:0 defining ranges as well
- PC20:2 - PC40:6 defines ranges with min and max lipid
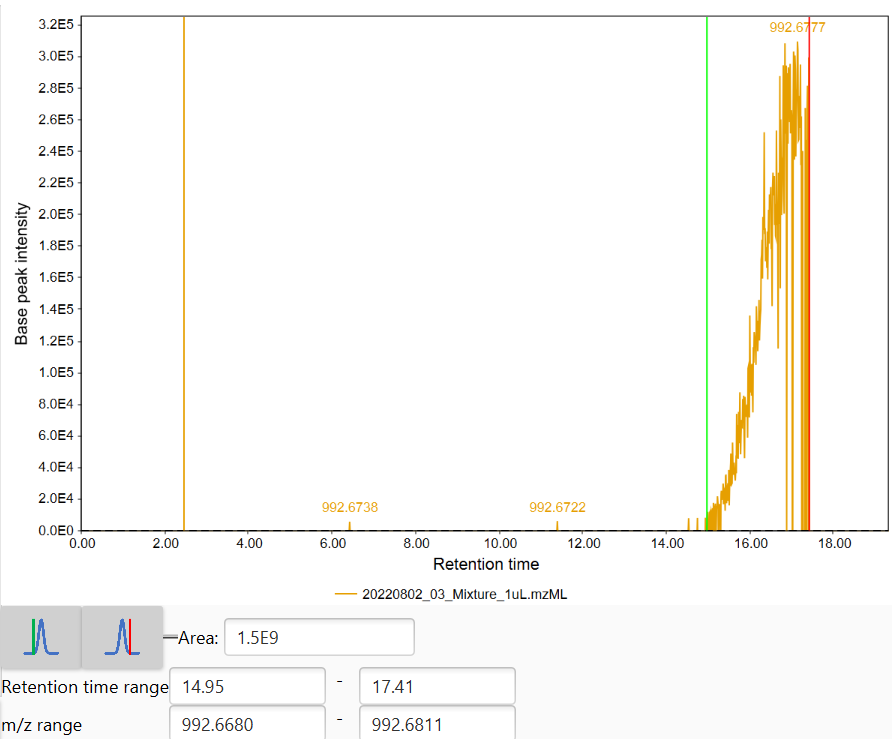
Manual feature integration
Tip
Manual integration was moved to the Integration dashboard that can be opened from the quick module access (CTRL + F or hit double shift). The integration dashboard can also be opened by right click on a feature list and then Integration dashboard.
The manual feature integration directly from the feature table is outdated and we advice to use the Integration dashboard. The old dialog still works though. The old dialog can be found by opening a feature table, right clicking on a cell that is within a specific sample (right side of the table) and then Define manually.