Lipid Annotation summary
Warning
This module requires lipid annotations from the Lipid Annotation module.
Description
Visualization → Lipid annotation summary
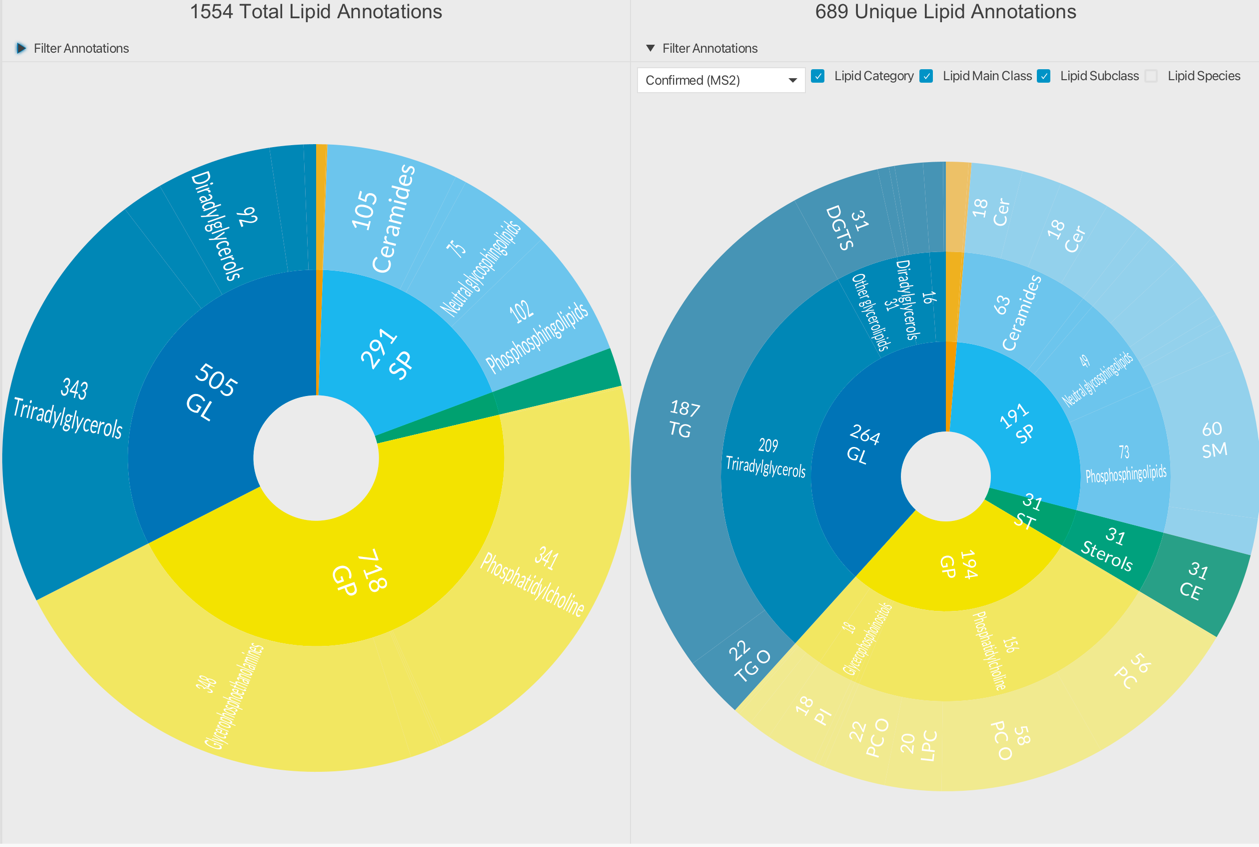
This module summaries all lipid annotations of a selected feature list in form of a sunburst chart. The layers from inside to outside follow the LipidMaps hierarchy: - Lipid Category - Lipid Main Class - Lipid Sub Class - Lipid Species
Unfolding the accordion "Filter Annotations" allows to control which hierarchy level should be displayed.
The left plot shows the total of all lipid annotations, including multiple annotations per feature. Multiple annotation levels (species and molecular species level) are not counted. The right plot shows the unique number of lipids, meaning the number of annotated features.

Both plots can be filtered individually. You can display: - "All", including all lipid annotations regardless of annotation quality - "Confirmed (MS2)", only annotations confirmed by MS2 fragments - "Unconfirmed (only MS1)", only annotations not validated by MS2, solely based on MS1 accuracy
Parameters

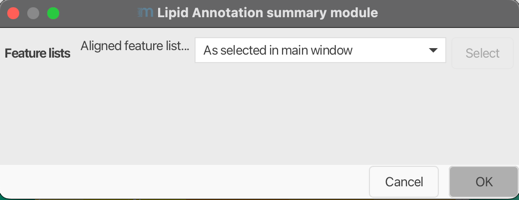
Feature List
Select one feature or aligned feature list.