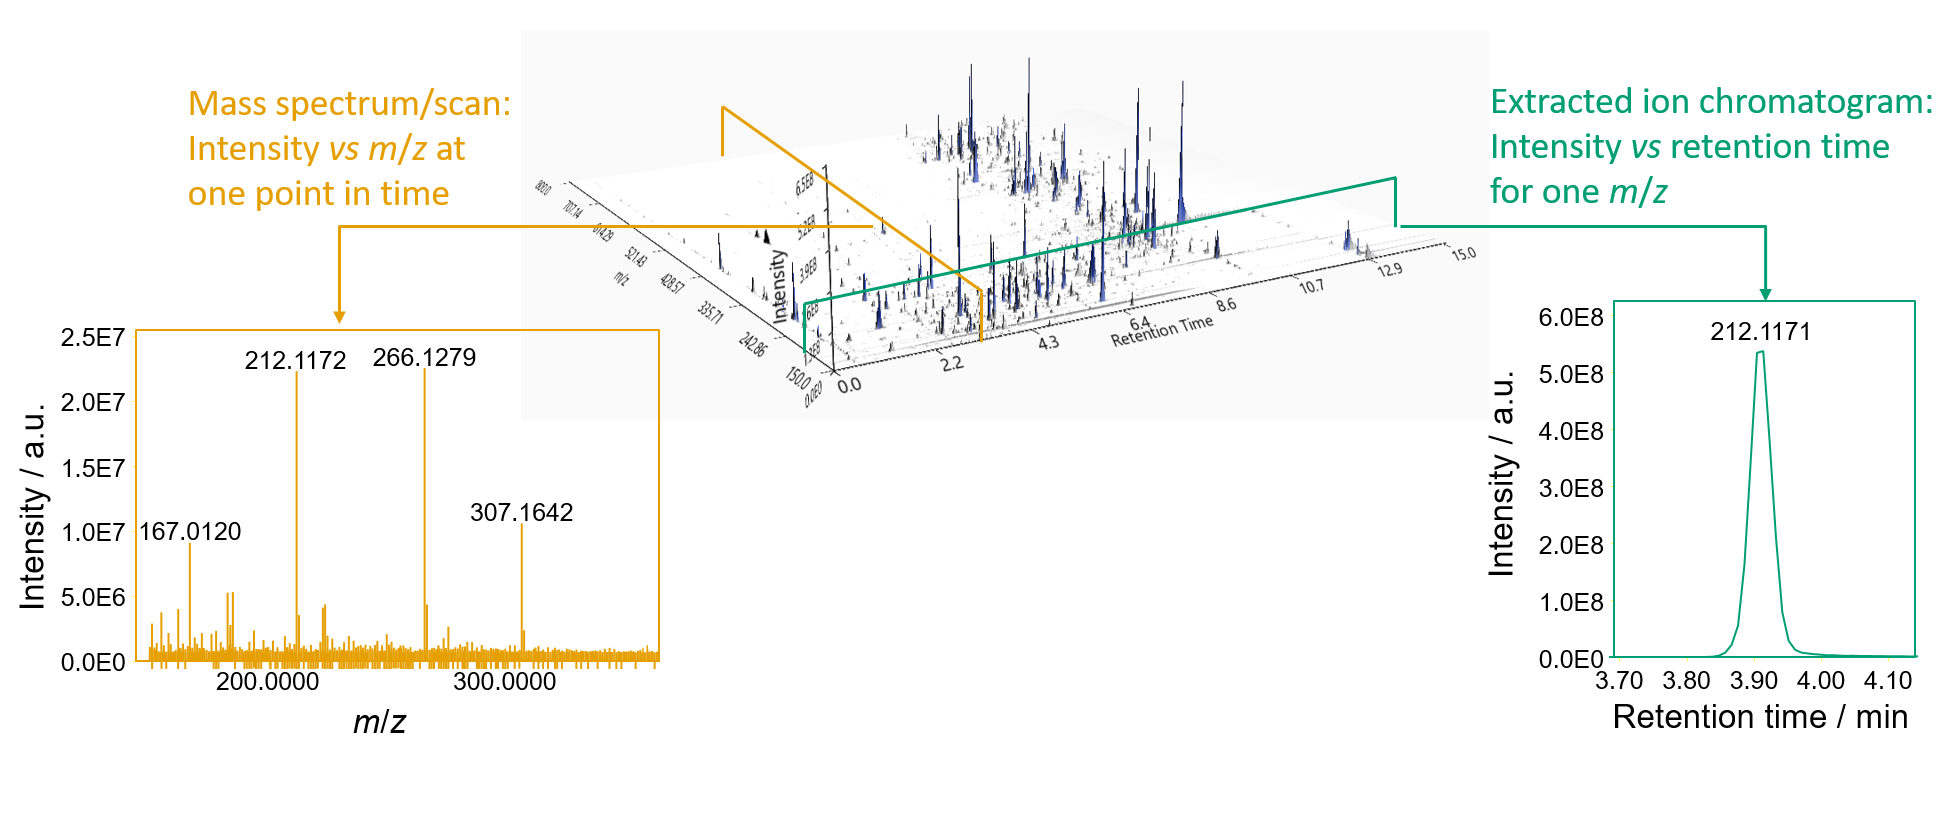
Graphical comparison of LC-MS and LC-IMS-MS data
Classic LC-MS data consists of three dimensions:
- m/z,
- intensity,
- and retention time.
At every retention time, a whole mass spectrum is acquired (yellow). Putting all scans together creates a three-dimensional plane. By slicing the three-dimensional data at a single m/z value (+- a value of tolerance), EICs can be created (green).

Ion mobility resolved data, on the other hand, consists of a three-dimensional data plane at each retention time. The three dimensions being:
- m/z,
- intensity,
- and mobility (as drift time (ms) or inverse reduced mobility \(1/K_0 [Vs/(cm^2)]\)).
The 3D projection of regular LC-MS data can be created by summing all mobility scans of a frame to create a frame spectrum. (see Mobility scan merging)
