Chromatogram builder
Description
Feature detection → LC-MS → Chromatogram builder
The Chromatogram builder module is one of the LC-MS feature detection algorithms provided by mzmine. The module essentially builds an EIC for each m/z value that was detected over a minimum number of consecutive scans in the LC-MS run. Each data file is processed individually. The mass list associated to each MS1 scan in a data file (see Mass detection module) are taken as input and a feature list is returned as output. Since a mass list must be available, the Mass detection module must be run first.
The Chromatogram builder algorithm operates as follows:
- Only MS1 scans are processed.
- All the data points are extracted from all the MS1 scans in a data file and sorted in order of decreasing intensity.
- The processing starts from the most intense data point. Since no EICs have yet been created, a new EIC is initialized and associated to the corresponding m/z value.
- The processing proceeds with the second-highest data point. The corresponding m/z is checked to determine if it "belongs" to the existing EIC (based on the user-defined tolerance, i.e. "Scan to scan accuracy (m/z)" parameter).
- If yes, then the data point is added to the EIC and the EIC-associated m/z is updated. Otherwise, a new EIC is initialized.
- The process repeats iteratively until all the data points have been processed and a set of EICs has been created.
- Finally, the EICs are checked according to the user-defined parameters (i.e. minimum number of data points and intensity). The EICs matching the requirements are retained in the feature list, whereas the rest are discarded.
The so-built EICs can then be resolved into individual features by one of the deconvolution algorithms provided by mzmine (e.g. Local minimum resolver module).
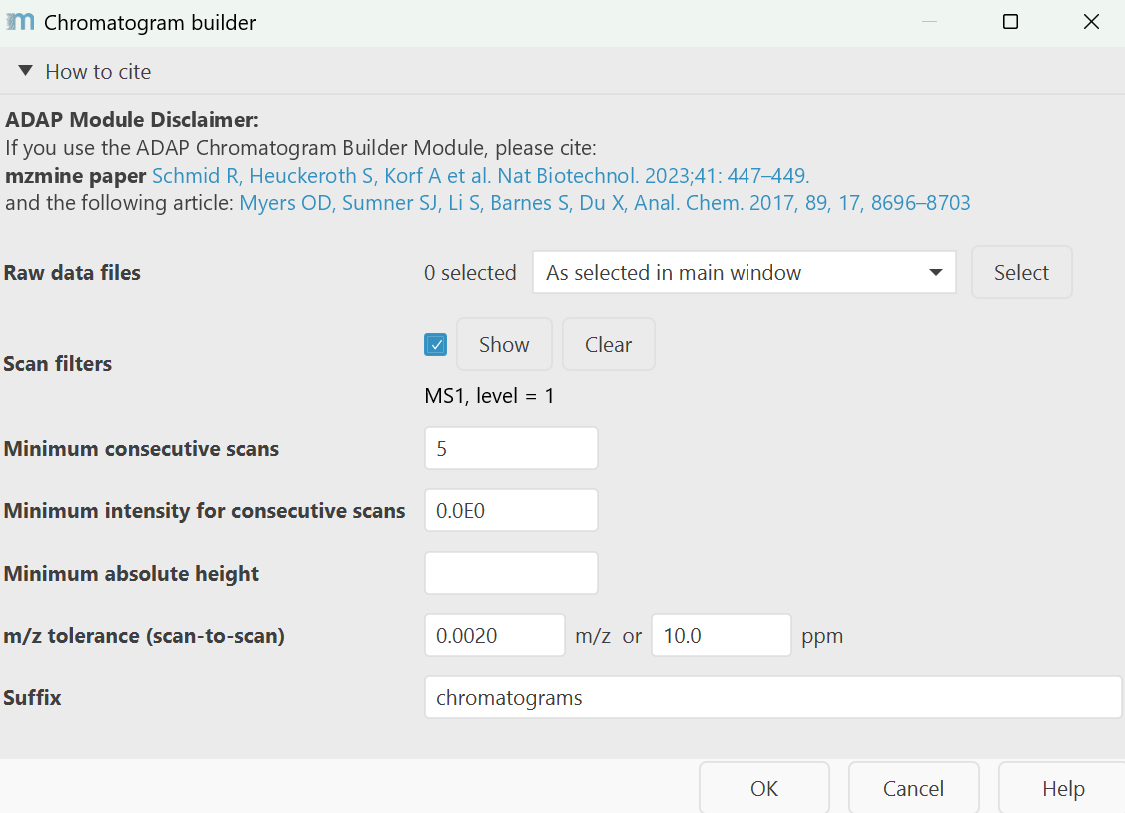
Parameters
Raw data files
Select the input raw data files for chromatogram building. Mass lists associated with the data files will be automatically selected. See option descriptions in Mass detection module.
Scan filters
Select (or filter out) the MS scans to be processed. Although setting the MS level = 1 is usually enough for this module, several filters are available (see option descriptions in Mass detection module). For example, specific RT ranges (e.g. dead volume, equilibration time, calibration segments, etc.) can be excluded from the processing by setting the corresponding filter.
Tip
For polarity switching data, choose one polarity to produce chromatograms in either ion mode.
Minimum consecutive scans
Minimum number of consecutive MS1 scans where an m/z must be detected with a non-zero intensity in order for the corresponding EICs to be considered valid and retained in the feature list.
This parameter largely depends on the chromatographic system setup (e.g. HPLC vs UHPLC) and the acquisition rate (a.k.a. MS scan speed) of the mass spectrometer. The best way to optimize this setting is by manually inspecting the raw data and determining the typical minimum number of data points of the LC peaks. Usually, no less than 4-5 should be used.
Minimum intensity for consecutive scans
The minimum signal intensity that the group scans (see previous parameter) must exceed in order for the corresponding EICs to be considered valid and retained in the feature list.
A good starting point for this parameter is 3 times the noise level used in the Mass detection, if the instrumental noise is used as cutoff. See also How do I determine the noise level in my data? for more details.
Minimum absolute height
Minimum intensity that the highest point in the EIC must exceed in order for the corresponding trace to be considered valid and retained in the feature list. This parameter mainly depends on the mass spectrometer characteristics (e.g. Orbitrap instruments normally provides higher signal intensities than TOF devices) as well as the overall goal of the processing. Overly low intensity thresholds normally leads to a larger number of background signals being retained as features, extending the overall processing time. On the other hand, overly high thresholds may lead to low-intensity features being erroneously discarded.
A good starting point for this parameter is 7-10 times the noise level used in the Mass detection, if the instrumental noise is used as cutoff. See also How do I determine the noise level in my data? for more details.
m/z tolerance (scan-to-scan)
Maximum allowed difference between an EIC-associated m/z and a new data point to be added to the existing EIC trace. It is essentially the maximum allowed mass accuracy deviation between consecutive data points in the EICs. The tolerance can be specified as absolute tolerance (in m/z), relative tolerance (in ppm), or both. When both are specified, the tolerance range is calculated using the maximum between the absolute and relative tolerances.
This is an m/z tolerance (scan-to-scan), and it depends on the mass accuracy, resolution and stability of the instrument. The best way to optimize this parameter is by manually inspecting the raw data and determining the typical fluctuation of the accurate mass measurement over consecutive scans. A good starting point is 0.002-0.005 m/z and 5-10 ppm for Orbitrap instruments, while 0.005 m/z and 10-15 ppm can be used for TOF devices.
Suffix
String added to the filename as suffix when creating the corresponding feature list.