Additional tools
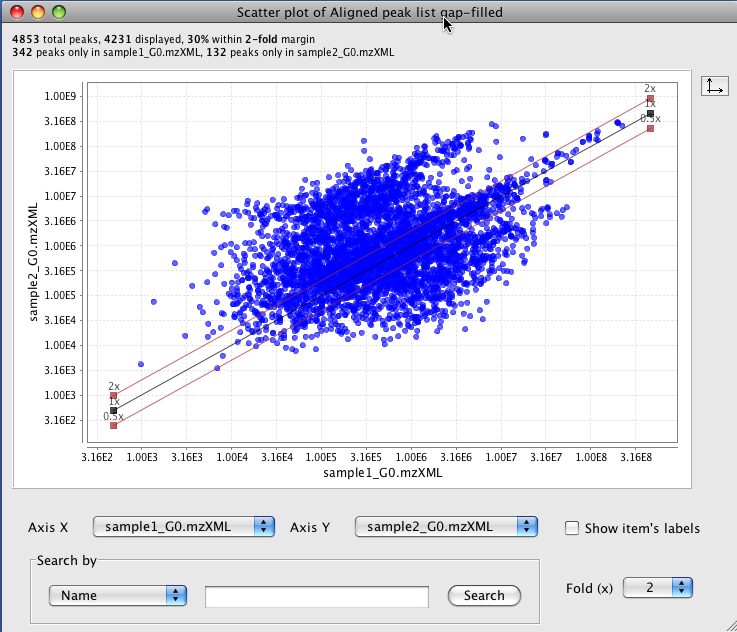
Scatter plot
Description
Visualization → Scatter plot
This tool shows a scatter plot with data from identified peaks in aligned feature list.
A search for a peak can be done using three options (name, retention time and m/z value).
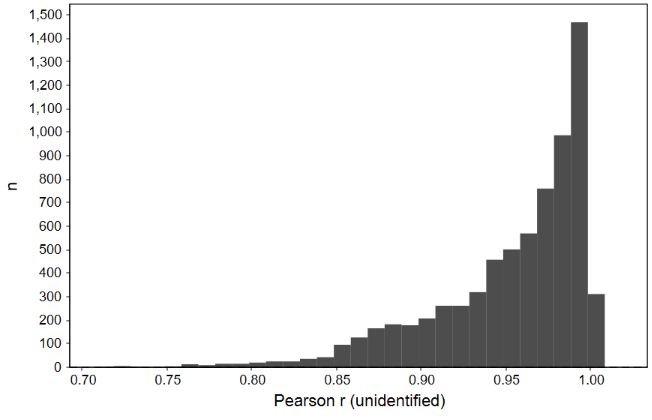
Correlated features \(\Delta\)m/z histogram
Description
Visualization → Correlated features \(\Delta\)m/z histogram
This module plots all m/z deltas between correlated features in a histogram and offers a Gaussian fit.
Parameters
Minimum Pearson correlation
Minimum Pearson correlation of feature shapes.
Limit delta to m/z
Maximum m/z delta is the m/z of the smaller ion (feature list row).
m/z bin width
Binning of m/z values for feature picking
Append to file
Append the correlated features delta m/z to a csv file.
Correlation coefficient histogram
Description
 This module is being updated. Some newer functionality might not be documented.
This module allows to plot all correlations between feature shapes.
Parameters
m/z bin width
Binning of m/z values for feature picking
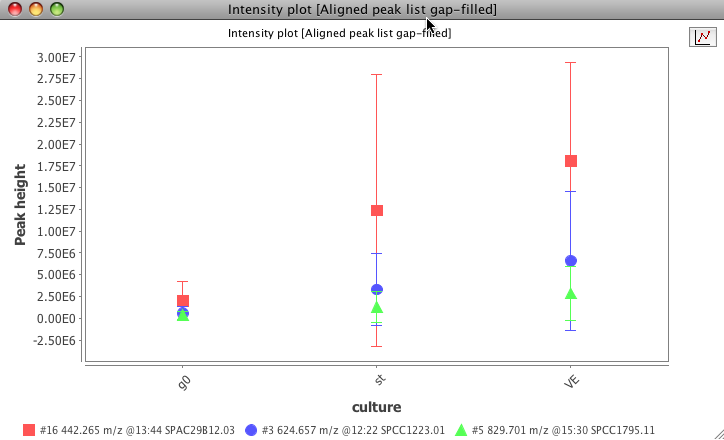
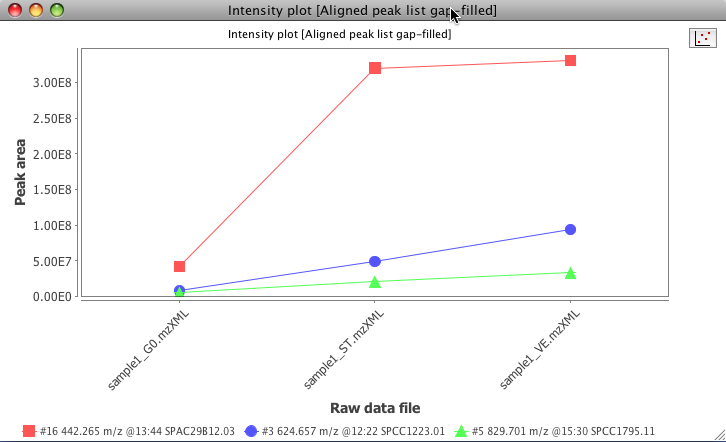
Feature intensity plot
Description
This module has a known bug and is being updated, which might affect its functionality.
Visualization → Feature intensity plot
This plot allows to explore specific features against the raw data.
Parameters
Data files
Selects the raw data files from where the peaks were detected
X axis value
X axis display the raw data file name or the parameter defined in the "set sample parameters" window
X axis value
The user can choose from peak's height, area or retention time value to display in this axis.
Peaks
The user can select the peaks to use in this plot.