Additional tools
Chromatogram plot
Description
Visualization → Chromatogram plot
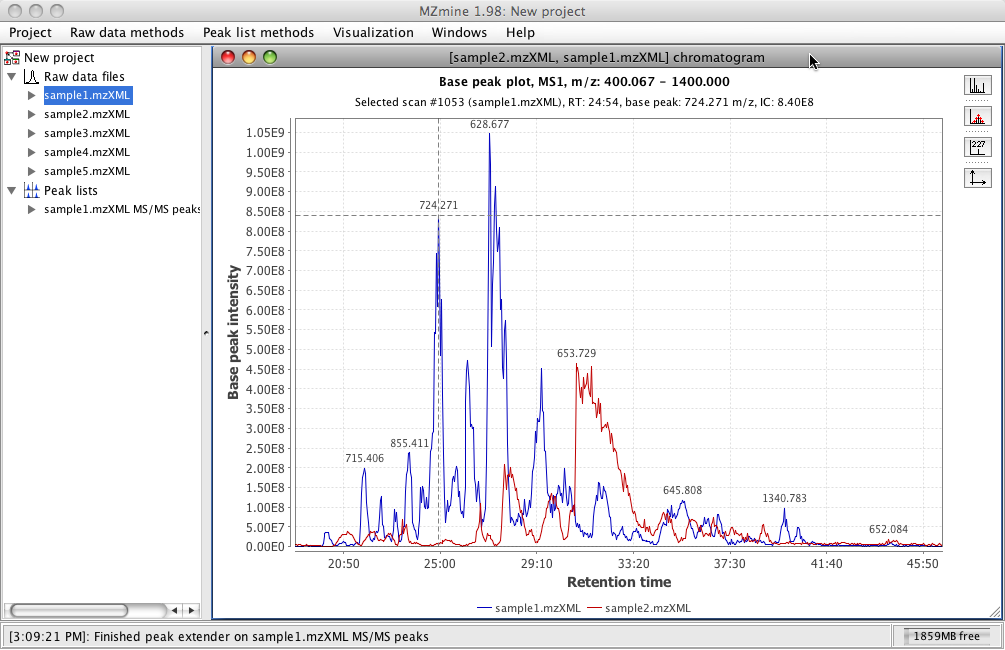
There is a possibility to display chromatographic peaks outside of raw data overview. This standalone two-dimensional plot visualizes TIC/XIC data. All the chromatograms are displayed in the same plot.
The x-axis corresponds to retention time and the y-axis is the intensity level of the signal.
Parameters
Raw data files
List of raw data files to display in the TIC visualizer.
MS level
Scan level (MS1,MS2,... ,MSn) to display in the plot.
Plot type
TIC or base peak
Retention time
Retention time (x-axis) range.
m/z range
Range of m/z values. If this range does not include the entire scan m/z range, the resulting visualizer is XIC type.
Selected peaks
List of chromatographic peaks to display in the TIC visualizer. This option is available only if a peak list related to the selected raw data file exists in the current project.
MS spectrum
Visualization → MS spectrum
Displays all the ions from a selected scan. Can be used to explore mass spectrum outside of raw data overview. Only one raw file can be chosen.
It shows a plot of two dimensions, where X axis corresponds to m/z value and Y axis is the intensity of the ion signal.
Parameters
Scan number
Choose the scan to visualize
2D visualizer
Visualization → Raw data → 2D visualizer
Shows raw data as a flat, color-coded intensity map, e.g. retention time and m/z. See 2D and 3D visualizer.
3D visualizer
Visualization → Raw data → 3D visualizer
Shows raw data as a three-dimensional relief with the intensity as height. See 2D and 3D visualizer.
Scan histogram
Description
Visualization → Scan histogram
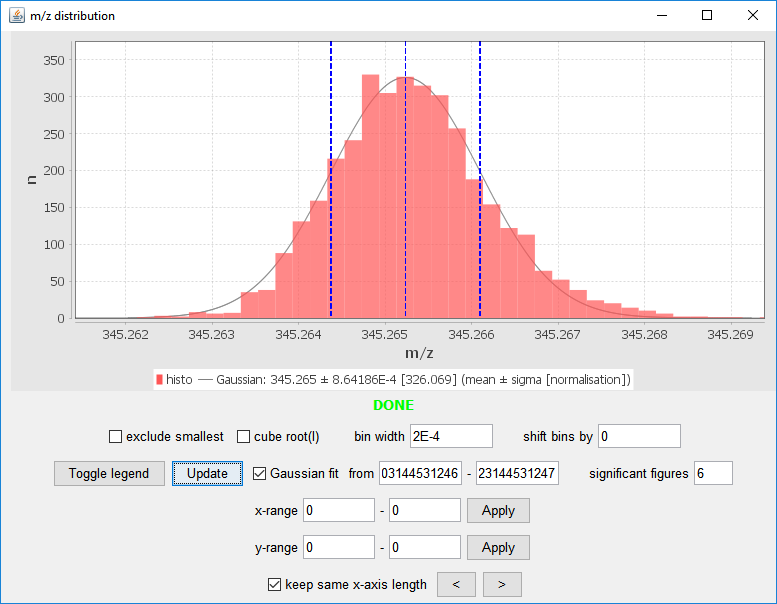
This module creates m/z distribution histograms of all m/z values in mass lists across specified scans. The binning width, in which the m/z values are counted, can be changed dynamically. The number of scans that contain a specific m/z value (bin) are plotted.
Parameters
Scans
Here user can set up the level (MS1,MS2,... ,MSn), polarity, retention time, and the other parameters of the scans to be used.
m/z
Limit the range of the histogram (can improve performance).
Signal intensity range
Optional parameter
Allows to limit signal intensities (can improve performance).
Mass defect
Optional parameter
Filters for mass defects in the signals.
Type
Type of the histogram to be created. Available options:
- m/z,
- Intensity,
- Intensity (noise recalibrated),
- Mass defect.
Bin width
The binning width to count m/z value occurence in scans.
Use mobility scans
If the input data has ion mobility dimension, this data can be used instead of the data from the summed frames.
Scan inject time analysis
MS(n) spectra tree